

The Weird Way We Automatically Extend Unemployment Benefits
The “insured unemployment rate” plays an important role in our unemployment insurance system. Should it?

In the U.S., unemployment insurance is structured as a weekly payment of up to X dollars for up to Y weeks, where X and Y vary according to the state in which your former employer operates. The value of X varies a lot, but in the majority of states, Y is equal to 26 weeks.
In particularly hard times, you can get Y+13 weeks of benefits, thanks to our “extended benefits” (EB) program. When a state experiences a period of high and rising unemployment, the EB program activates in that state. Unemployed workers can claim 13 weeks of additional benefits, with half the cost borne by the state and half by the federal government.
But if you look under the hood, the EB program’s definition of “high unemployment” is a bit odd.
Normally, when you are looking for a measure of unemployment in the U.S., you will find our “official” unemployment rate — known in this context as the “total unemployment rate” (TUR) — which is defined as the number of unemployed workers as a percentage of the total number of workers in the labor force.
But rather than using the TUR, the only mandatory “trigger” used in the EB program is based on the “insured unemployment rate” (IUR). The IUR is defined as the number of people receiving regular (non-extended) unemployment benefits as a percentage of the number of workers covered by the unemployment insurance system.
The “mandatory IUR trigger” for a state activates when two conditions are met:
the state’s average IUR for the previous 13 weeks is at least 5%
the average IUR for the previous 13 weeks is at least 20% higher than the average of the IURs for the corresponding 13-week periods in each of the previous two years
The insured unemployment rate or the unemployment insurance rate?
The basic issue with this design is that a state’s IUR has a mechanical relationship with its unemployment insurance program’s level of generosity. If a state makes it more difficult to receive unemployment benefits, then its IUR will go down because fewer people are receiving unemployment benefits, which in turn makes it less likely that it will have to pay out extended benefits. Indeed, that is exactly what has happened in the last few decades.
The following chart shows how the relationship between the IUR and TUR has changed over time. Each point represents an individual month between January 2000 and December 2019, with the TUR for that month plotted on the x-axis and the IUR plotted on the y-axis. The points are connected chronologically (Jan. 2000 → Feb. 2000 → March 2000, and so on).
The early 2000s are a bit of a mess because of the dot-com crash, but you can clearly see the Great Recession, as both the total unemployment rate and the insured unemployment rate grow quickly (moving up and to the right) over a short span. As the country recovers from the recession, both measures fall slowly. You can trace the line coming back around to see that for any given level of total unemployment, the insured unemployment rate ends up lower than would have been normal prior to the recession.
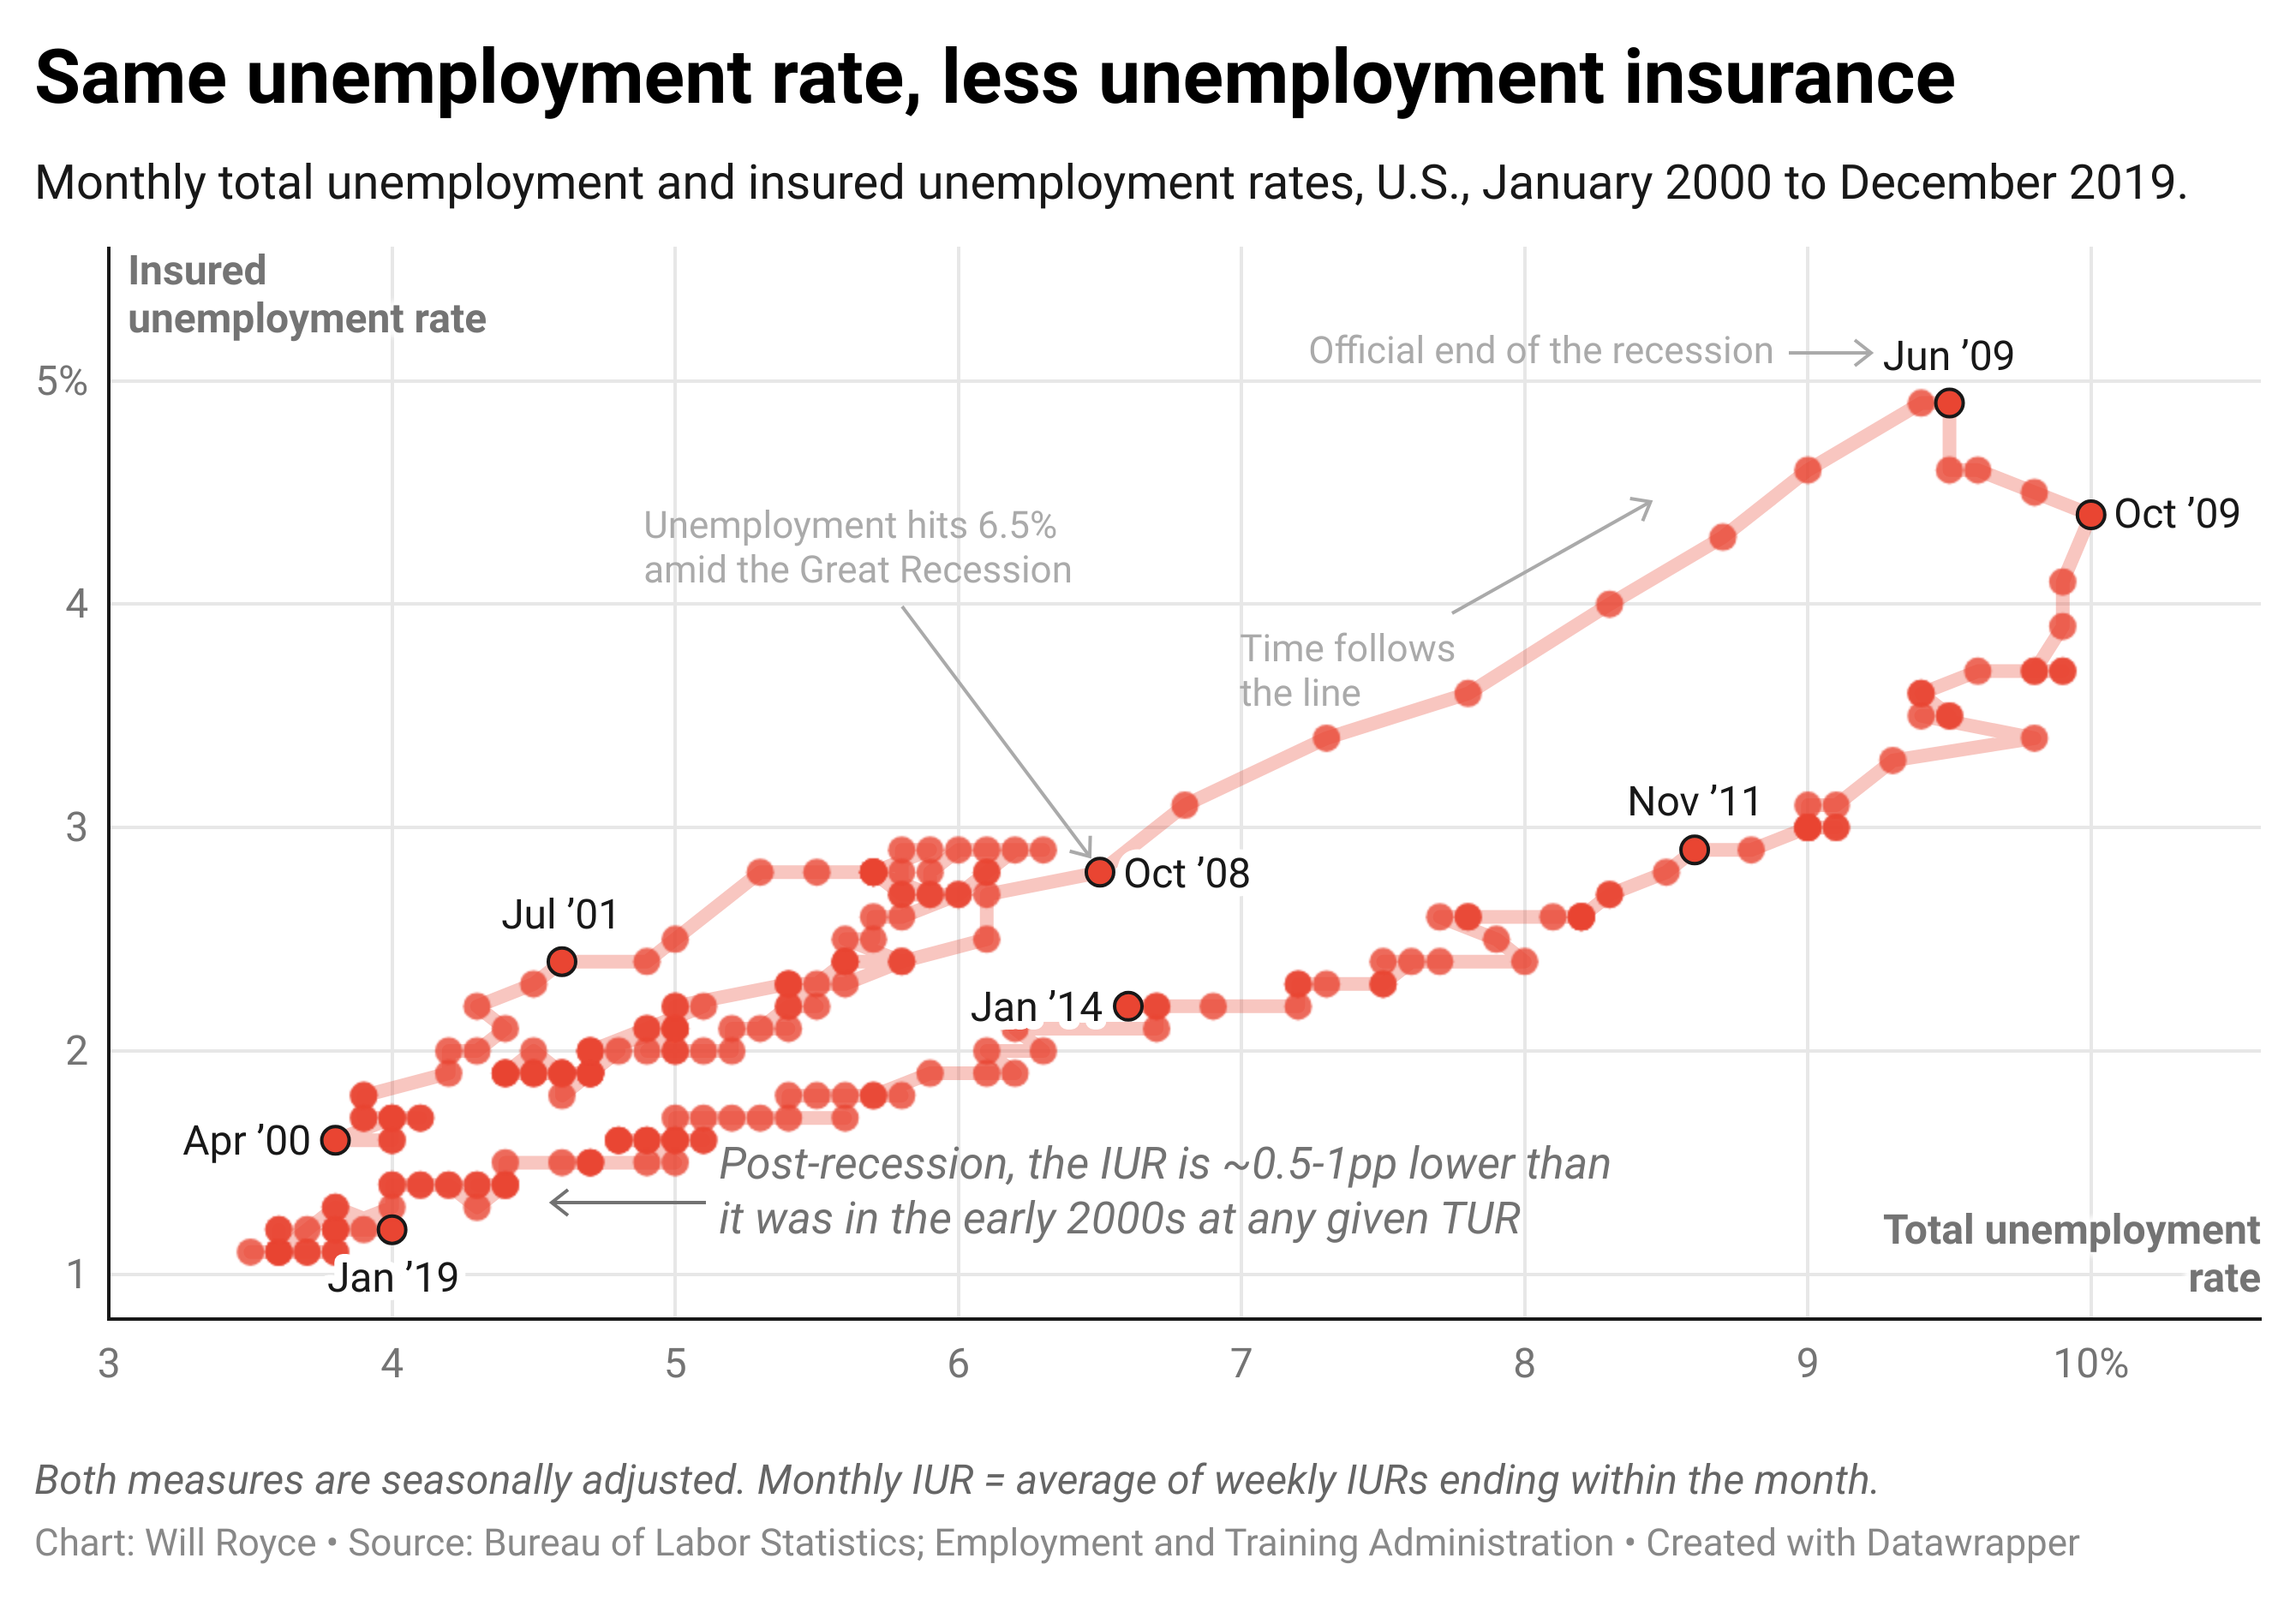
(Note also that even as the total unemployment rate exceeded 9%, the national insured unemployment rate never hit the 5% threshold that states need to hit for the mandatory IUR trigger — and the baseline level of the IUR only declined from there.)
To view the relationship between insured unemployment and total unemployment in a simpler way, we can instead look at the ratio of the IUR to the TUR, as plotted in the next chart from 1971 to present. The ratio goes down over time, which means that the IUR is declining relative to the TUR. One way to think about this is that the IUR is becoming a worse proxy for total unemployment.
The ratio of the IUR to the TUR is similar but not equivalent to a state’s “recipiency rate,” or the percentage of unemployed workers receiving unemployment insurance.1 The two measures differ since the IUR and the TUR have different denominators — the IUR uses “covered employment” while the TUR uses the number of workers in the labor force. The primary reason to look at the IUR as a percentage of the TUR is to compare them in the context of their use within the unemployment insurance system, rather than any inherent value in the metric itself.
But if you think about how we calculate a state’s recipiency rate — the total number of workers on unemployment insurance divided by the total number of unemployed workers — you can see why the IUR is an odd metric for automatically stabilizing unemployment insurance. Insured unemployment is the product of total unemployment and the recipiency rate, which in plain language, means that a state’s IUR will essentially be made up of two things: (1) the unemployment rate and (2) how difficult the state has made it to obtain and stay on unemployment benefits.
Thus, if a state doesn’t want to have to pay out extended unemployment benefits, one route for avoiding that seems to be to make it difficult to obtain benefits in the first place.
The many states of insured unemployment
So far we have looked at the decline of the IUR relative to the TUR in a national context, but it isn’t actually a national trend. Individual states that cut unemployment benefits are the culprits. In July 2013, North Carolina adopted a law making it so that claimants could receive as few as 12 weeks of unemployment benefits, whereas they had previously been able to receive up to 26 weeks.
This change predictably resulted in fewer workers in North Carolina receiving unemployment insurance relative to pre-recession levels, and thus fewer people were counted in the insured unemployment rate. The ratio of North Carolina’s IUR to its TUR dropped precipitously. States that did not cut benefits in this way, like California, saw no such drop.
If you compare the 13 states where the maximum duration of unemployment benefits is fewer than 26 weeks with the 37 states where the maximum duration is 26 weeks or more, you can see that this trend generalizes. In August 2025, the average IUR in the states with fewer weeks of unemployment insurance was about half that of the states with more weeks of unemployment insurance, even though the average TUR in the former states was actually slightly higher.
This should all make sense intuitively. Imagine for a second that, instead of being administered as a weekly payment, states just provided unemployment compensation as a lump sum. You would be counted as being on unemployment insurance for only one week, and so the state’s insured unemployment rate would plummet, despite no actual change in the total unemployment rate.
So to recap: If you provide people with fewer weeks of unemployment benefits, then there will be fewer people among the insured unemployed at any given point in time. And if there are fewer people counted in your insured unemployment rate, then you are less likely to be on the hook for extended benefits.
Total victory for total unemployment
There is an alternative: While states are required to use the mandatory IUR trigger, there are two optional triggers that state governments can adopt at their pleasure.
The first is the “optional IUR trigger,” where extended benefits activate if the 13-week average of the state’s IUR is greater than 6%. The majority of states have adopted this trigger, but it is rare that they actually meet the threshold — only seven states met it at the height of the Great Recession.
The second is the “optional TUR trigger,” where extended benefits activate if the three-month average of the state’s seasonally-adjusted TUR is (1) at least 6.5% and (2) at least 10% greater than the average TUR in either or both of the two previous years for the same corresponding three-month period. If you adopt this trigger, you also have to provide an additional seven weeks of unemployment benefits — on top of the EB program’s usual 13 — if the three-month average of your seasonally-adjusted TUR is 8% and also meets condition (2).
Only 12 states currently have the optional TUR trigger in place, though the thresholds are more consistently met by states in recessionary periods than either of the two IUR triggers.
Some states have adopted the TUR trigger on the condition that the federal government pays the full costs of extended unemployment benefits, instead of the usual 50%. These states have perhaps realized that, although we have the EB program to serve as an automatic stabilizer, in effect, our real automatic stabilization mechanism is that the federal government has historically enacted temporary expansions of unemployment insurance during recessions, and the EB program as written has played only a limited role.
But so long as we’re going to have a measure for automatically extending unemployment benefits, it might be good if that measure actually tracks economic distress rather than the generosity of states’ social insurance systems.
State IURs as a percentage of state TURs will tend to be slightly greater than actual recipiency rates:
Good read 👏🏽